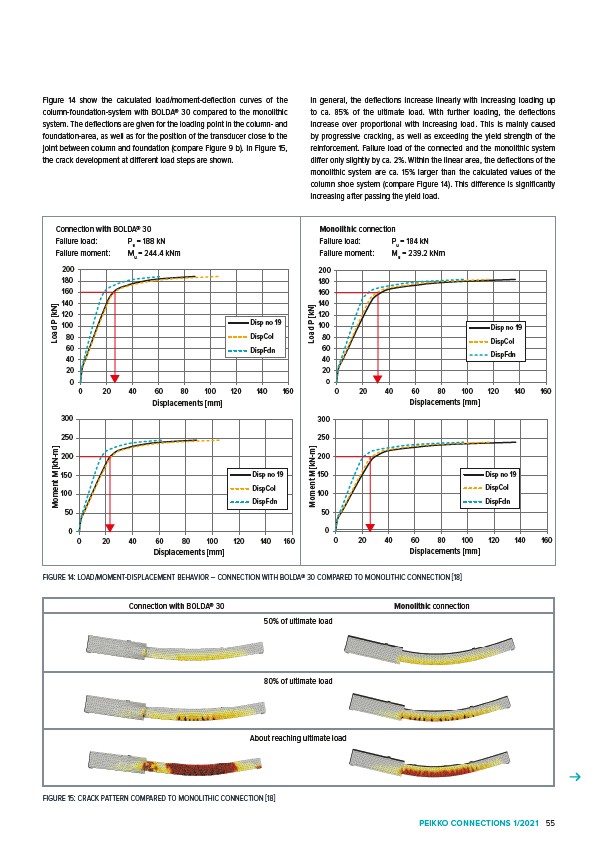
Figure 14 show the calculated load/moment-deflection curves of the
column-foundation-system with BOLDA® 30 compared to the monolithic
system. The deflections are given for the loading point in the column- and
foundation-area, as well as for the position of the transducer close to the
joint between column and foundation (compare Figure 9 b). In Figure 15,
the crack development at different load steps are shown.
Load P kN
Displacements mm
Disp no 19
DispCol
DispFdn
200
180
160
140
120
100
80
60
40
20
0
0 20 40 60 80 100 120 140 160
BOLDA
300
250
200
Moment M kN
Displacements mm
Disp no 19
DispCol
DispFdn
0 20 40 60 80 100 120 140 160
150
100
50
0
-m
In general, the deflections increase linearly with increasing loading up
to ca. 85% of the ultimate load. With further loading, the deflections
increase over proportional with increasing load. This is mainly caused
by progressive cracking, as well as exceeding the yield strength of the
reinforcement. Failure load of the connected and the monolithic system
differ only slightly by ca. 2%. Within the linear area, the deflections of the
monolithic system are ca. 15% larger than the calculated values of the
column shoe system (compare Figure 14). This difference is significantly
increasing after passing the yield load.
200
180
160
140
120
100
80
60
40
20
0
0 20 40 60 80 100 120 140 160
Load P kN
Displacements mm
Disp no 19
DispCol
DispFdn
300
250
200
150
100
50
0
0 20 40 60 80 100 120 140 160
Moment M kN-m
Displacements mm
Disp no 19
DispCol
DispFdn
Monolithic connection
Failure load: Pu = 184 kN
Failure moment: Mu = 239.2 kNm
Connection with BOLDA® 30
Failure load: Pu = 188 kN
Failure moment: Mu = 244.4 kNm
FIGURE 14: LOAD/MOMENT-DISPLACEMENT BEHAVIOR – CONNECTION WITH BOLDA® 30 COMPARED TO MONOLITHIC CONNECTION 18
Connection with BOLDA® 30 Monolithic connection
50% of ultimate load
80% of ultimate load
About reaching ultimate load
FIGURE 15: CRACK PATTERN COMPARED TO MONOLITHIC CONNECTION 18
PEIKKO CONNECTIONS 1/2021 55