with different methodological approach-es
and designs were included.
Exclusion criteria:
1. Articles that use coloured images
as input
2. Articles with 3D tomography as
the reconstructed output
3. Review articles
Identification and selection
of articles
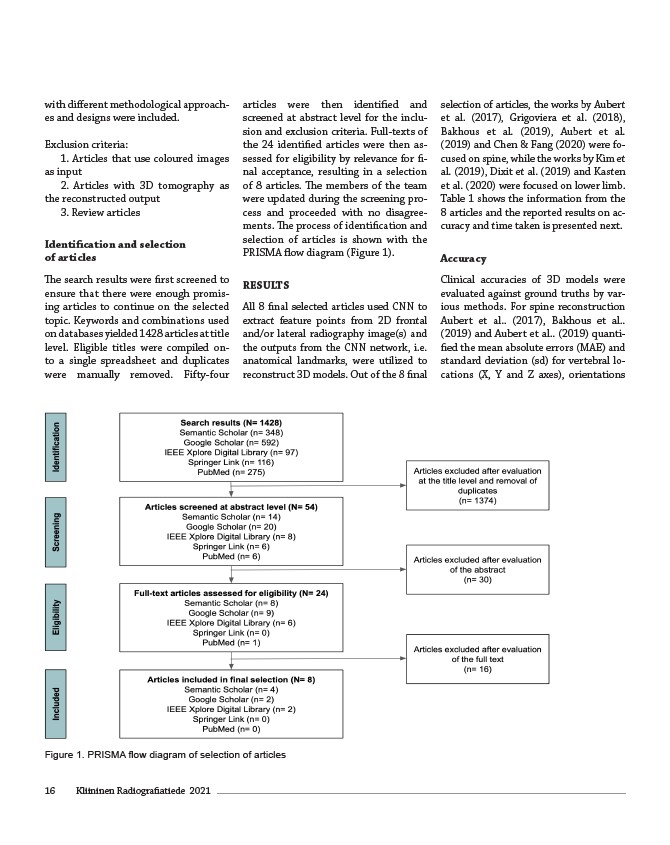
The search results were first screened to
ensure that there were enough promis-ing
articles to continue on the selected
topic. Keywords and combinations used
on databases yielded 1428 articles at title
level. Eligible titles were compiled on-to
a single spreadsheet and duplicates
were manually removed. Fifty-four
16 Kliininen Radiografiatiede 2021
articles were then identified and
screened at abstract level for the inclu-sion
and exclusion criteria. Full-texts of
the 24 identified articles were then as-sessed
for eligibility by relevance for fi-nal
acceptance, resulting in a selection
of 8 articles. The members of the team
were updated during the screening pro-cess
and proceeded with no disagree-ments.
The process of identification and
selection of articles is shown with the
PRISMA flow diagram (Figure 1).
RESULTS
All 8 final selected articles used CNN to
extract feature points from 2D frontal
and/or lateral radiography image(s) and
the outputs from the CNN network, i.e.
anatomical landmarks, were utilized to
reconstruct 3D models. Out of the 8 final
selection of articles, the works by Aubert
et al. (2017), Grigoviera et al. (2018),
Bakhous et al. (2019), Aubert et al.
(2019) and Chen & Fang (2020) were fo-cused
on spine, while the works by Kim et
al. (2019), Dixit et al. (2019) and Kasten
et al. (2020) were focused on lower limb.
Table 1 shows the information from the
8 articles and the reported results on ac-curacy
and time taken is presented next.
Accuracy
Clinical accuracies of 3D models were
evaluated against ground truths by var-ious
methods. For spine reconstruction
Aubert et al.. (2017), Bakhous et al..
(2019) and Aubert et al.. (2019) quanti-fied
the mean absolute errors (MAE) and
standard deviation (sd) for vertebral lo-cations
(X, Y and Z axes), orientations
Figure 1. PRISMA flow diagram of selection of articles